Paul A. Beata
This is a portfolio site showcasing some of my recent data science and machine learning projects.
Data Science Portfolio
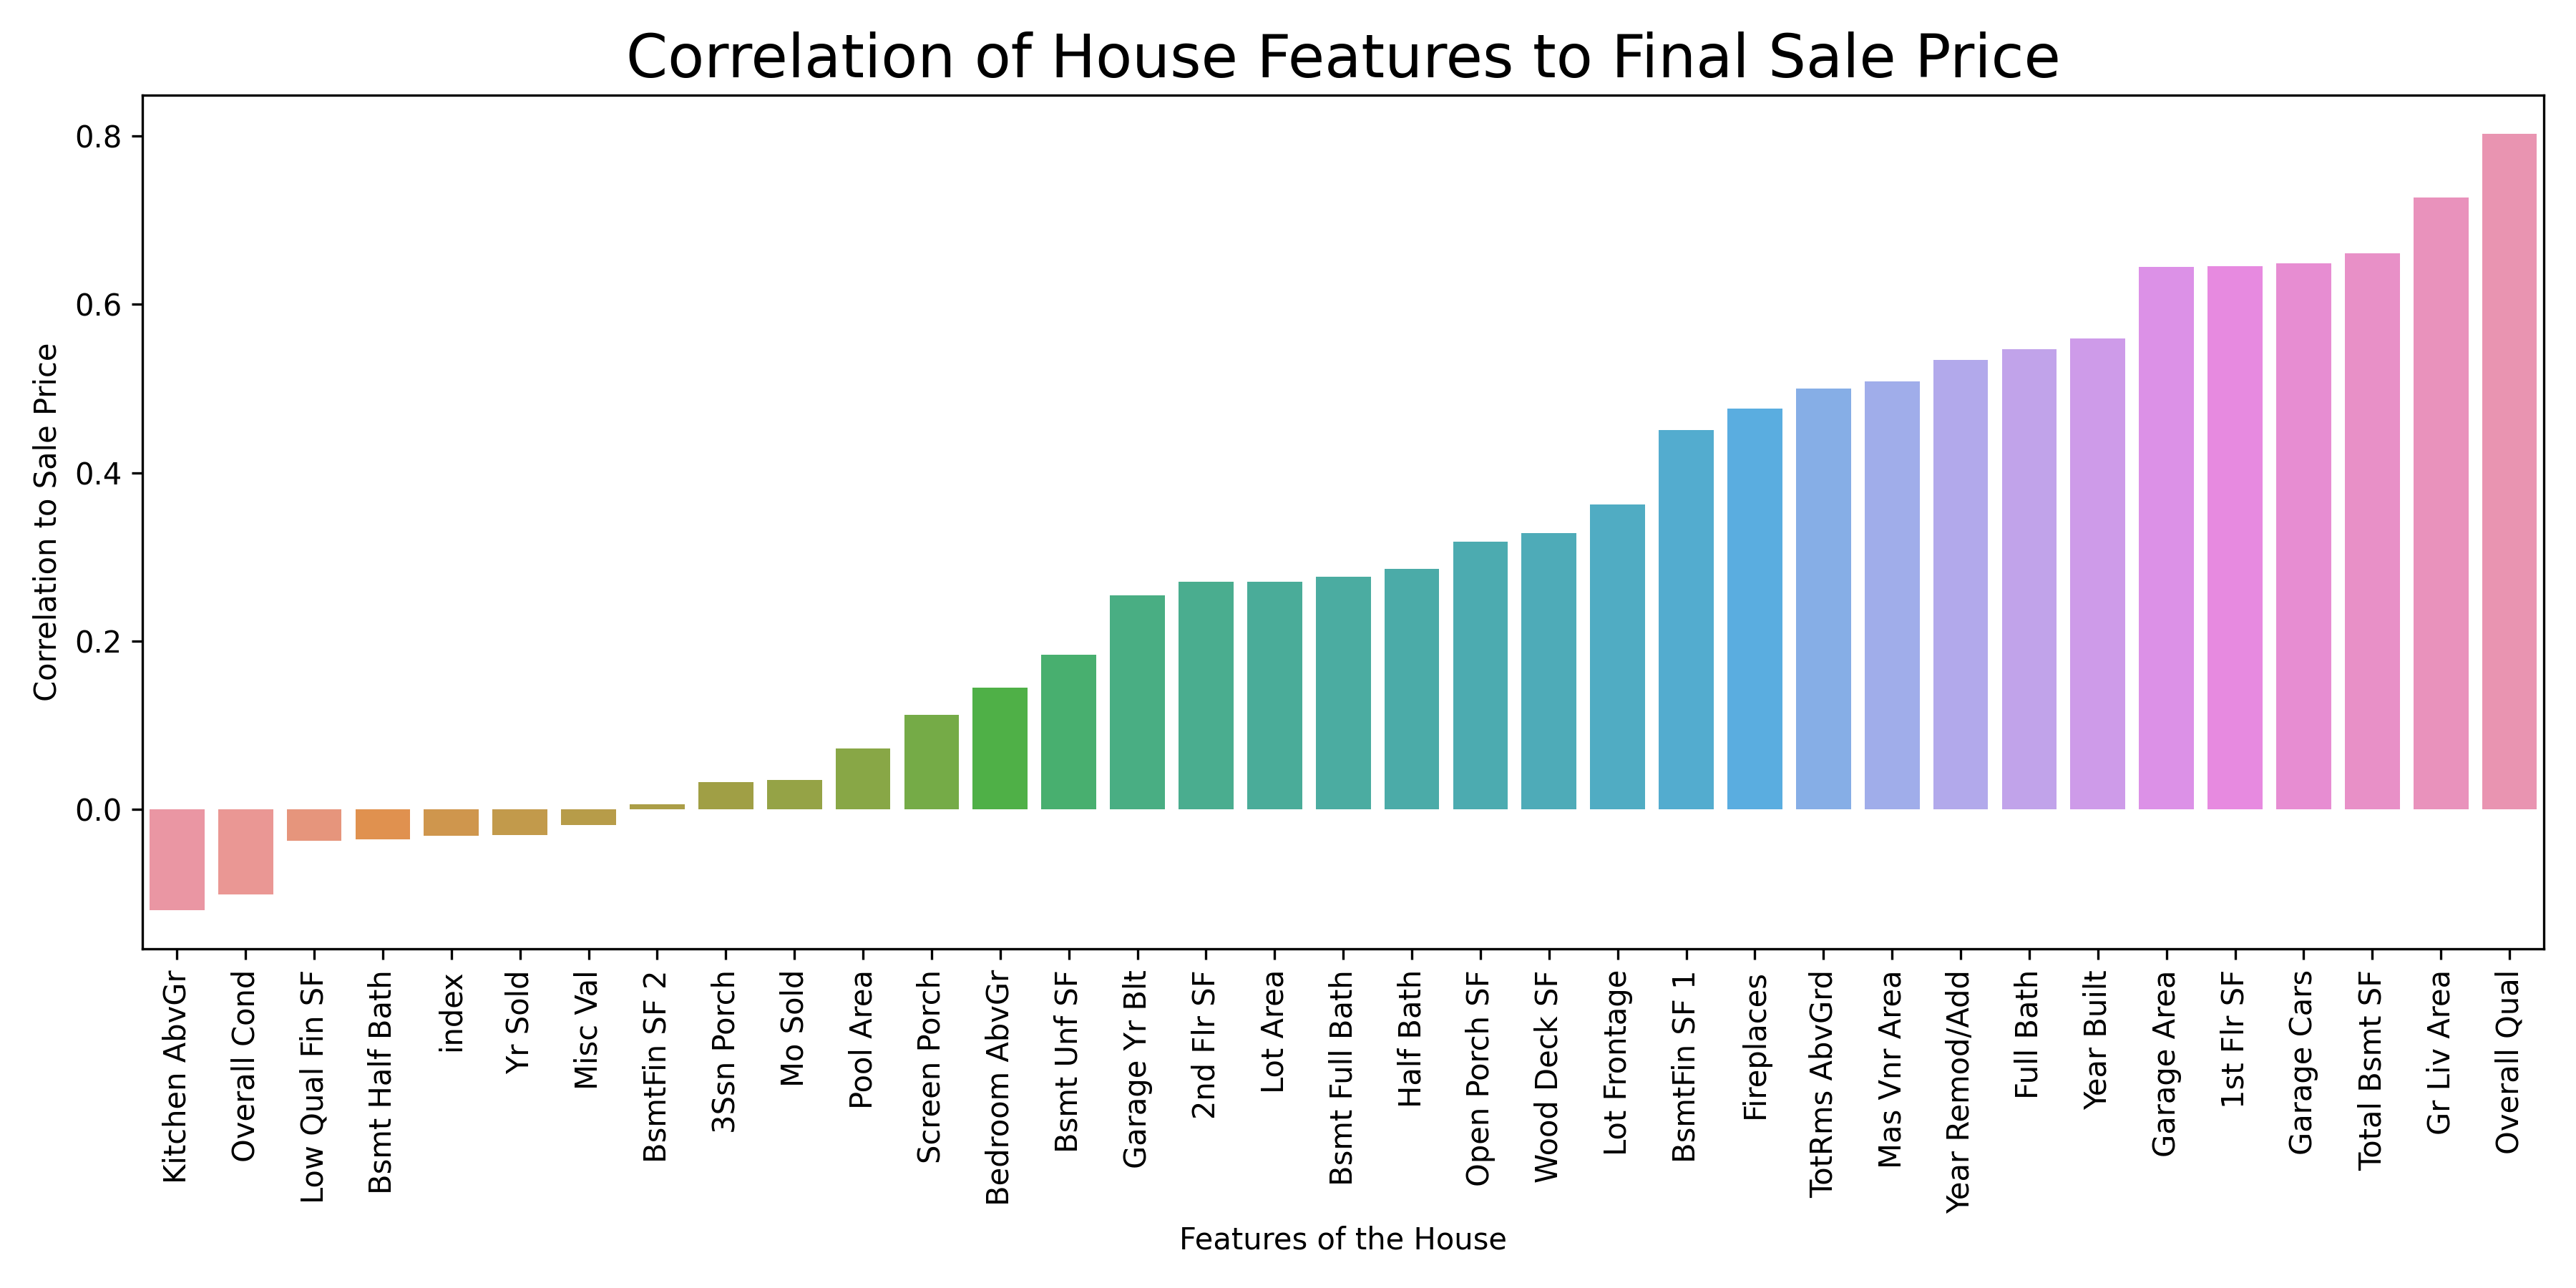
Project 1: Housing Price Regression Model
| View Notebooks in Browser: Data Preprocessing | Regression Model |
- Developed regression models using real estate data from the 2011 Ames Iowa Housing Data on Kaggle containing 2930 observations and 81 fields (features)
- Performed exploratory data analysis (EDA) with NumPy, Pandas, and Seaborn to understand the missing data and observe which features have strong correlations with the final sale price
- Performed data preprocessing by systematically handling all missing values in the raw data set: removed outlier observations (3) and filled all null values with either “0”, “None”, or a statistical estimate (e.g., mean), depending on the appropriate choice for each feature
- Used Scikit-learn to develop regression models using an elastic net model, ridge and lasso regularization, ordinary linear regression, and a random forest regressor
- Performed grid search cross validation to find optimal values of hyperparameters
- Employed lasso regression and achieved mean absolute error (MAE) of $14,191 and RMS error of $20,554, where the average house price in the data set was $180,815 (relative MAE = 7.8%)
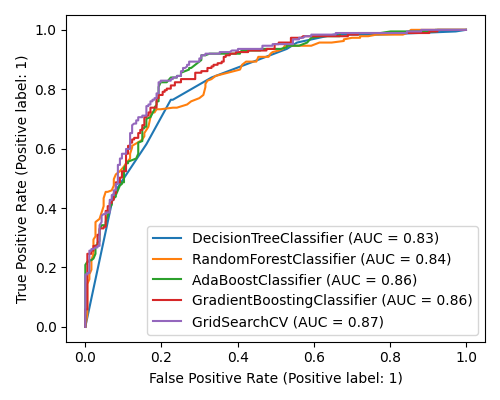
Project 2: Client Churn Predictor
| View Notebook in Browser: Classification Models |
- Developed classification models using customer data from a telecommunications company containing 7032 observations (rows, each representing unique customers) and 21 fields (features + target)
- Using historical data about the customers, such as their tenure with the telecom service, their contract type, etc., and data regarding customer churn, we built classifiers for predicting future customer churn
- Performed exploratory data analysis to understand the relationships between contract type, charges (fees), services, and tenure, and how these factors affected the company’s churn rate
- Used cohort analysis to investigate the differences among cohorts: we found that customers on a one-year or a two-year contract were much less likely to churn than customers who are on month-to-month contracts
- Employed various tree-based methods, such as Single Decision Trees, Random Forests, AdaBoost classifier, and Gradient Boosting, as well as Support Vector Machines and K-Nearest Neighbors to perform this classification task
- Using a grid search with 10-fold cross validation on the AdaBoost classifier, we found that the optimal learning rate and number of estimators were 0.25 and 100, respectively: this leads to an accuracy of 82% and similar recall (between 80% and 83%)
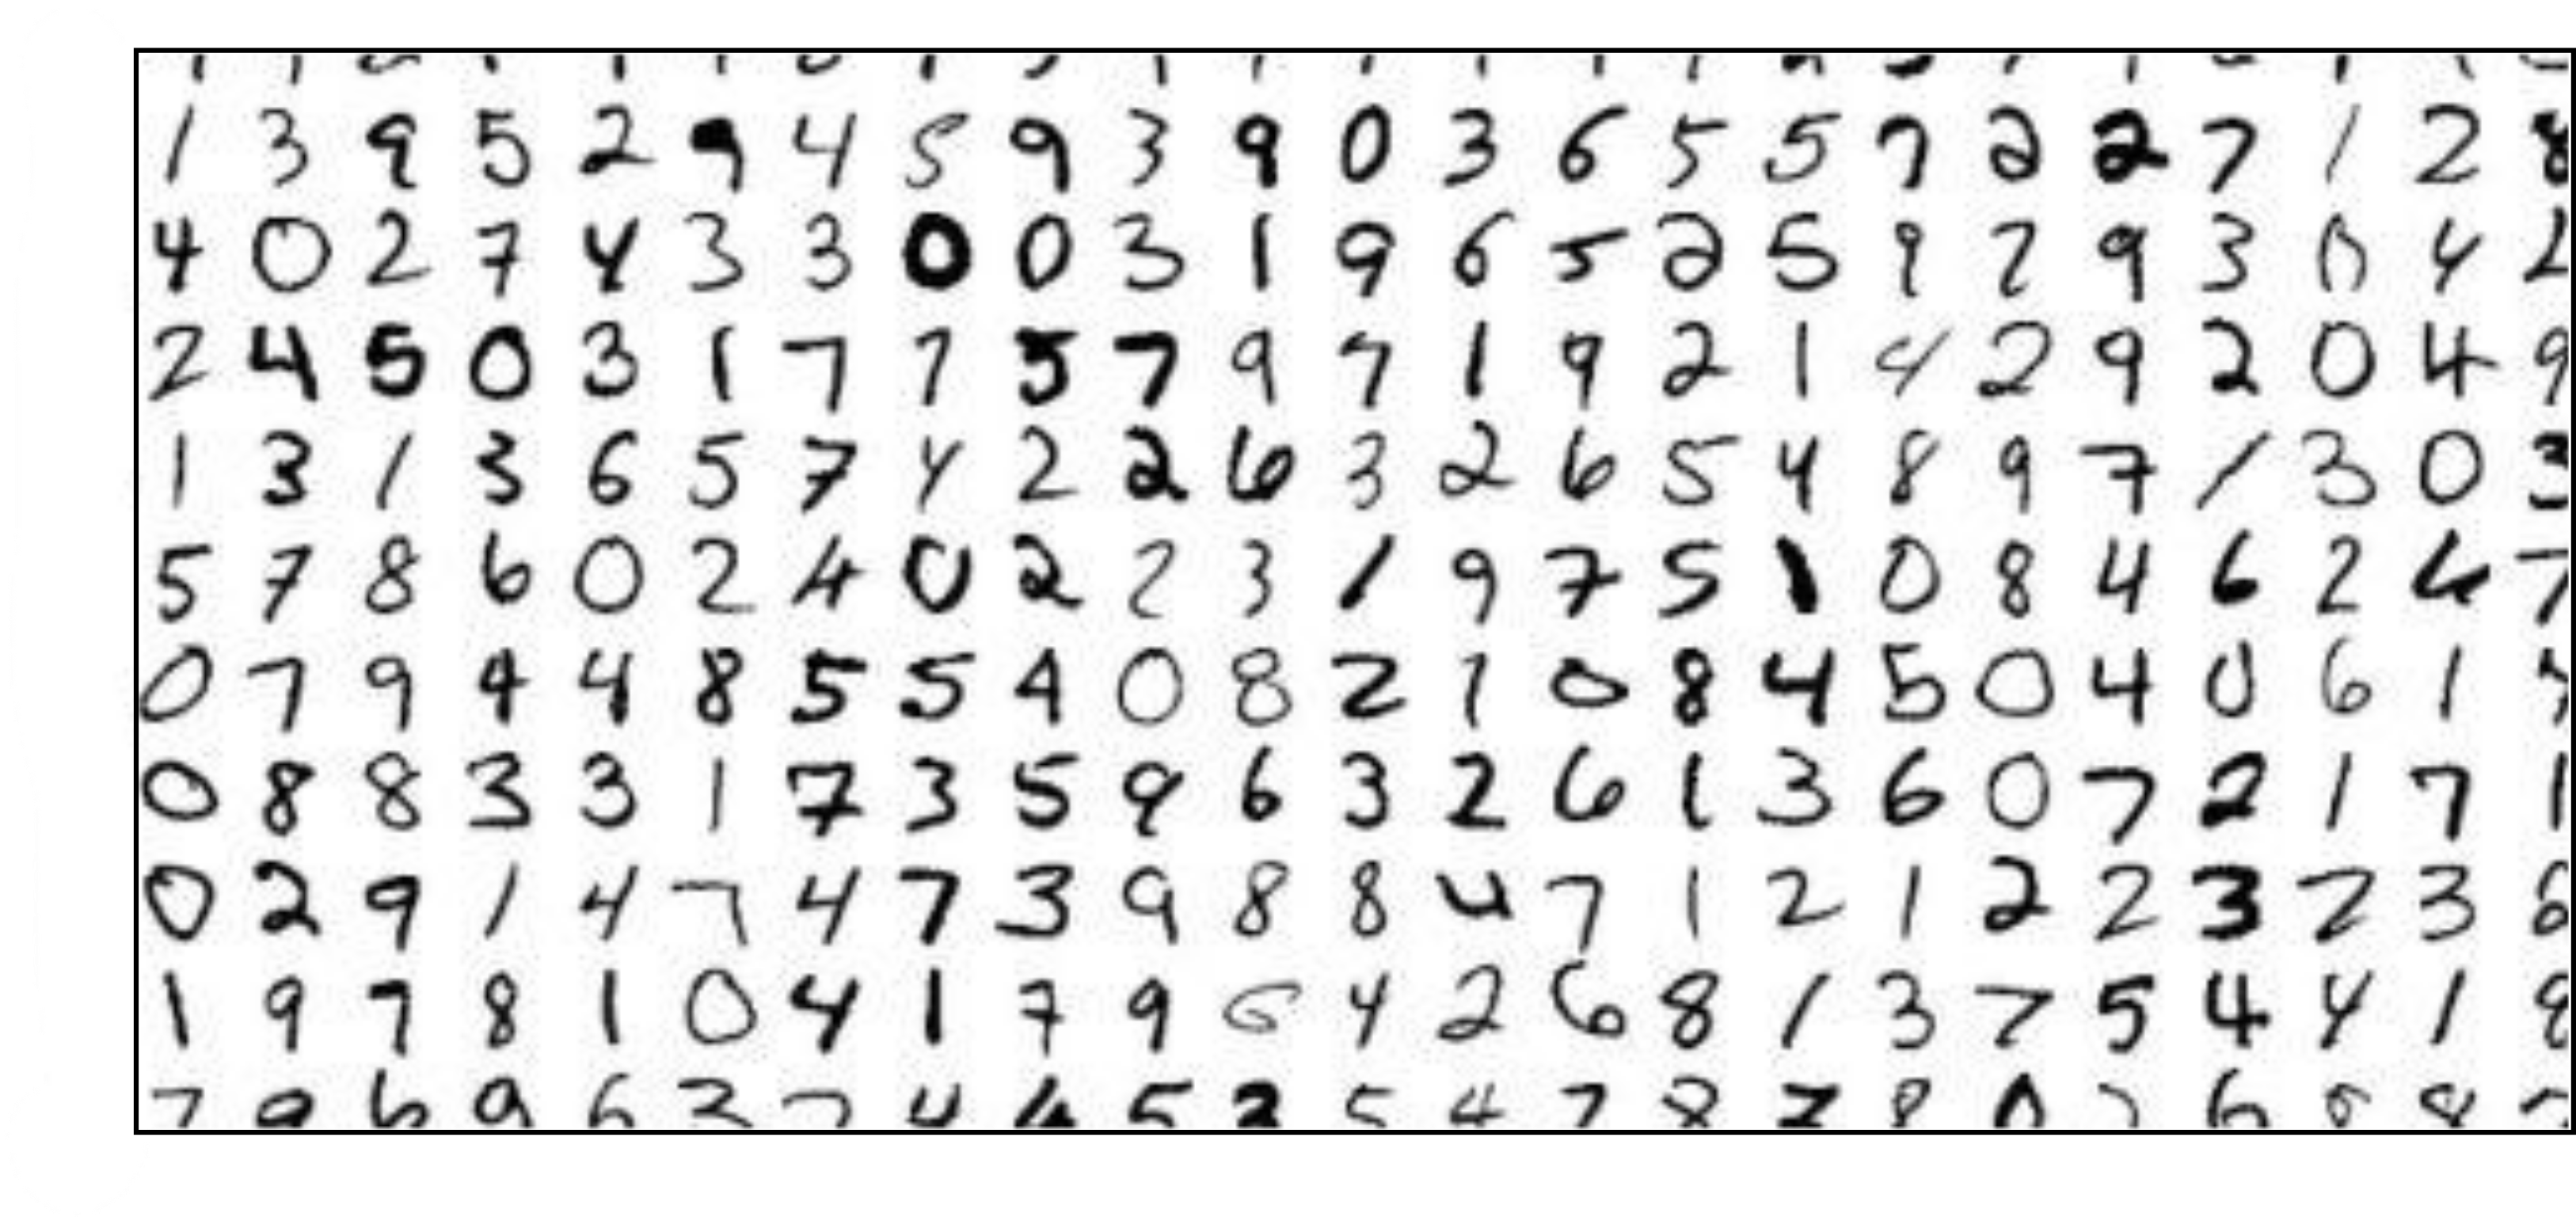
Project 3: Handwritten Number Recognition
| View Notebook in Browser: Neural Net Models |
- Built deep neural networks to perform image recognition and classification of handwritten digits from the MNIST data set
- The MNIST data set contains 70,000 handwritten digits split into training and testing sets: for data preprocessing, we generate a third set for validation using a subset (10%) of the training data
- Each image in the set is comprised of 28x28 grayscale pixels ranging in value from 0 to 255: as part of the data preprocessing, we scale these pixels value to the range of [0, 1] as well
- For training the deep neural net, we vary the width and depth of the model in search of an optimal solution: tested hidden layers sizes (width) of 8, 16, 32, 64, 128, and 256 and the number of layers in the NN (depth) used were 2, 4, and 8
- Using four layers in the NN with a size (width) of 256 nodes, we achieve an classification accuracy of 98.1%; meaning, we correctly classified 9,813 handwritten images out of the 10,000 total in the testing data subset
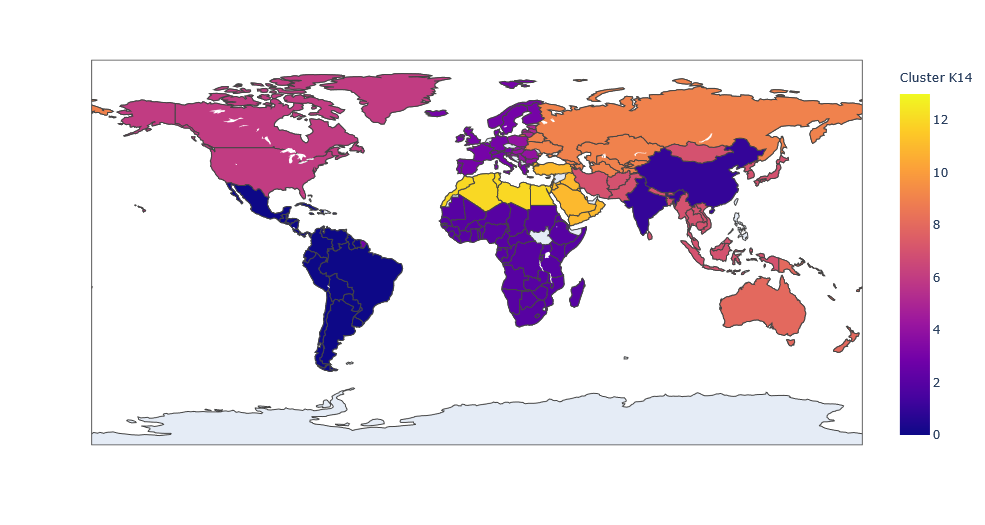
Project 4: CIA Country Analysis and Clustering
| View Notebook in Browser: K-Means Cluster Analysis |
- In this project, we aim to gain insights into similarities and between countries and regions of the world through exploratory data analysis and by experimenting with different clusters of countries
- The data set is taken from the CIA World Factbook and contains statistics from over 220 countries (rows); features (columns) include population, land area, birth rate, literary rate, GDP per capita, and other 18 other descriptors
- First, we perform data preprocessing to clean the data set: handled missing data by filling null values with appropriate approximations (e.g., zeroes or region-based means) and converted categories into dummy variables
- Performed unsupervised machine learning to cluster countries into distinct groups based on the given features, without prior knowledge of group labels: purely exploratory cluster analysis to observe various cluster produced by K-Means clustering with scikit-learn
- Using the elbow method to find, we identified several potential clustering arrangements that could be used to group similar countries together: we identified potential groupings into either 3, 6, or 14 distinct groups based on the elbow method analysis
- Visualized various clustering results using the plotly library with ISO country codes to generate maps of the world colored by our cluster analysis groupings